A Suggested Curriculum for Undergrad Data Science
It's intern season which basically means two things for me:
The meetings generally have this feel:
I reviewed the current course offerings at a few schools, and settled on a list of 14 basic classes (and some electives at the end) that I think should be part of every data science curriculum. Here is my list:

Econometrics may seem like an outlier, but there are concepts of predictive modeling such as time-series analysis, dealing with collinearity, endogeneity and auto correlation which are best taught in the context of econometrics.


This is intended to be a reasonable list of classes for young people interested in data science. It serves two purposes really:
- I feel really old in the office.
- I take a lot of meetings with young people wanting to be data scientists..
The meetings generally have this feel:
Hi, I have interest in becoming a data scientist and I want to get your perspective on what that might take, let's meet for coffee.The interns that setup these meetings come from a wide range of backgrounds and skill levels. Many times they are interested in which classes they should take to be competitive for data science roles after they graduate. I thought it would be helpful to put the advice I give them into a blog post so more people can read it.
I reviewed the current course offerings at a few schools, and settled on a list of 14 basic classes (and some electives at the end) that I think should be part of every data science curriculum. Here is my list:
MATH
- Calculus I, II, III
- Differential Equations
- Linear Algebra

STATISTICS
- Intro to Stats
- Calculus Based Stats
- Generalized Research Method Class
- Econometrics
Econometrics may seem like an outlier, but there are concepts of predictive modeling such as time-series analysis, dealing with collinearity, endogeneity and auto correlation which are best taught in the context of econometrics.

COMPUTER SCIENCE
- Programming I, II
- Data Structures
- Fundamentals of Computer Algorithms
- Introduction to Database Systems
Sometimes I question the value of formal education in coding, some of the best programmers I know have degrees in non-computer fields. That said, computer science is still a core skillset for data scientists, and is required knowledge to be hired by someone like me (if you have the skills from another source that's great, just figure out a way to demonstrate it with an application/in an interview).

ELECTIVES
As for electives in the data science space, these should be modeled towards what specifically you want to do.
- If you want to go into business, take classes in economics, business operations, and accounting.
- If you want to go into algorithm development, focus more time in advanced computer science classes.
- If you want to go into academic research, focus on whichever academic discipline you are most interested in.
CONCLUSION
This is intended to be a reasonable list of classes for young people interested in data science. It serves two purposes really:
- Provide a framework for undergrads looking to become a data scientist.
- Prevent me from saying things I later regret when confronted by students who want to be data scientists without taking math.
A Common R Mistake: R Factor-Numeric Conversions
For the most part the R statistical system is a robust and fast way to quickly execute statistical analyses. Other times the annoyances and "tricks" it contains for more junior analysts on the system, leads me to encourage new analysts to opt for Python instead.
One of the biggest tricks inside of R for junior analysts involves a specific data type called "factors," attempted type conversion, and a sometimes difficult to detect programming issue.
Factors are a data type specific to R that helps statistician deal with categorical data. In CS terms, factors help statisticians deal with non-numeric low-cardinality variables. In most statistical processes this type of variable will be converted to binary dummies, so their storage in situ is less important.
Here is an official description from Berkley's R documentation regarding the storage of factors.
What does this actually mean? When storing a factor, R strips out all of the actual text and replaces it with index numbers correlated to the textual values and stores the index numbers instead. This both saves space in data frame storage and logically makes sense in the way these are used by statisticians.
And this process is mostly invisible to user for *most* processes...
That is, until you try to convert a factor to something else.

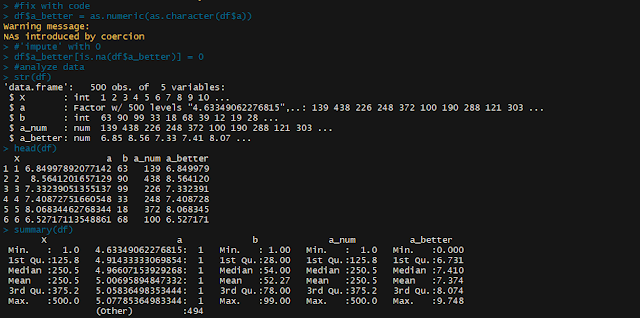
We see a data frame with 3 columns "x" appears to be an index, "b" is just a simple numeric field. But "a" is weird. It looks like numbers, but for some reason R thought it was a factor. This is where the mistake starts:
If we create a new column in our data set containing the type-converted data we see:

Wait.. what? This now seems to be *correlated* to but with completely different values than our original column. Here's the trick:

The function finds that your numeric column of data also includes values 'a' and 'b' which are preventing numeric conversion. Let's say now you realize the issue, and are aware that 'a' and 'b' should be converted to 0. You can easily make this conversion after forcing the values to numeric-but first converting to character, as so:
Now we see the column 'a_better' seems to directly represent the original values in 'a'.
The combination of these functions make it easy to:
To finish this up I thought I would give two examples of times when I've almost been burnt by this functional weirdness in R.
Scenario One
I was analyzing a dataset that had an interesting distribution-it was monetary data, but rounded to the nearest dollar, and involved integer values from -1 to 250-with some higher outliers. Remember that as.numeric() replaces a factor scale with an integer index starting at 1. The dataset also included some NULL values, represented by the word NULL (this is how the Python-Spark export created the data).
When I downloaded and imported the data it initially came in as factor, and (not thinking) I simply forced the type conversion. This had the effect of creating NA from the prior NULLs which I knew were assumed 0's and fixed with a simple df[is.na(df)] = 0 statement. The problem was that now my scale was shifted approximately two values higher due to the initial distribution-but the variance was still the same, the percent of 0's were reasonable, and generally the data was still reasonable.
After about an hour of working with the data, I noticed that I was a bit too far off of control totals I had run in PySpark, and backed into my problem, fixed and moved on.
This speaks to a major risk in the factor conversion problem: when the dataset is made up of integers very near zero, the error is difficult to detect.
Scenario Two
In scenario two I was dealing with geospatial data, a polygon shapefile at the zip code level (what our external vendor could handle). I had crossed it with a few massive 'points layers' and was creating an analysis of output zips using some fairly massive distance and customer travel pattern analytics. At one point I needed to link the zip codes up to some additional zip code based data, but the join failed because the zip codes were factors.
Knowing I was only dealing with zip codes in the United States, I quickly used the as.numeric() without thinking. In this case (if you know about zip codes you can imagine what happened) the new factor levels lead to effectively a scramble join. I would have missed this completely, except that my last step involved visualizing the zips in a nationwide map-which looked completely random.
The point of this anecdote: as usual, visualizing data can be a powerful check against otherwise undetectable coding mistakes.
One of the biggest tricks inside of R for junior analysts involves a specific data type called "factors," attempted type conversion, and a sometimes difficult to detect programming issue.
WHAT ARE FACTORS
Factors are a data type specific to R that helps statistician deal with categorical data. In CS terms, factors help statisticians deal with non-numeric low-cardinality variables. In most statistical processes this type of variable will be converted to binary dummies, so their storage in situ is less important.Here is an official description from Berkley's R documentation regarding the storage of factors.
What does this actually mean? When storing a factor, R strips out all of the actual text and replaces it with index numbers correlated to the textual values and stores the index numbers instead. This both saves space in data frame storage and logically makes sense in the way these are used by statisticians.
And this process is mostly invisible to user for *most* processes...
That is, until you try to convert a factor to something else.
HOW DOES THE PROBLEM START?
This system works fine, until you need to convert that data to something else. And here's the key instance where I've seen that occur: Let's say that you're importing some data that you're not entirely familiar with, So you run something like this to import and inspect your data:
We see a data frame with 3 columns "x" appears to be an index, "b" is just a simple numeric field. But "a" is weird. It looks like numbers, but for some reason R thought it was a factor. This is where the mistake starts:
- Junior analyst converts this value directly to number (as.numeric() which works in many other programming languages and the SQL that is often use by data scientists.)-and continues on with their day.
- Three hours later the junior analyst (who may be a bit unfamiliar with the business problem to be solved) turns in a work product that has completely bizarre results and is confusing to the business-they must be wrong. So what happened?
WHAT ACTUALLY HAPPENED
Let's split the process apart and see what actually happens when you as.numeric() a factor.If we create a new column in our data set containing the type-converted data we see:

Wait.. what? This now seems to be *correlated* to but with completely different values than our original column. Here's the trick:
'When factors are converted to numeric using as.numeric() it pulls the underlying index numbers and not the actual values, even if that actual value appears to be a number.'Essentially: Even though column 'a' looks like numbers, R ignores that and pulls an internal ID number R uses as backend lookup. This can be deceptive, especially when your level of missingness is relatively low after the type conversion. Confusing this a bit, is that expected correlations generally hold up after the conversion, because the index numbers are ordered-it's simply the magnitude + variance that changes.
FIXING THE PROBLEM
Fixing the problem is easy, you simply convert to character (as.character()) before converting to numeric. This conversion uses the actual data values, gets rid of our index numbers. But what if you want to know why your variable was converted to factor in the first place by read.csv(). I've written the following function for which to check the values that came in that natively fail numeric conversion: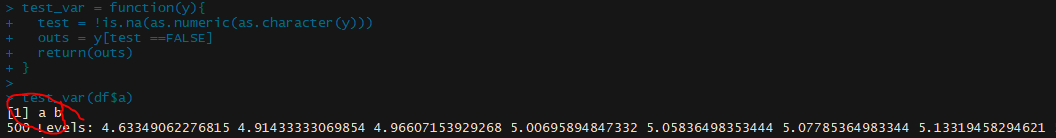
The function finds that your numeric column of data also includes values 'a' and 'b' which are preventing numeric conversion. Let's say now you realize the issue, and are aware that 'a' and 'b' should be converted to 0. You can easily make this conversion after forcing the values to numeric-but first converting to character, as so:
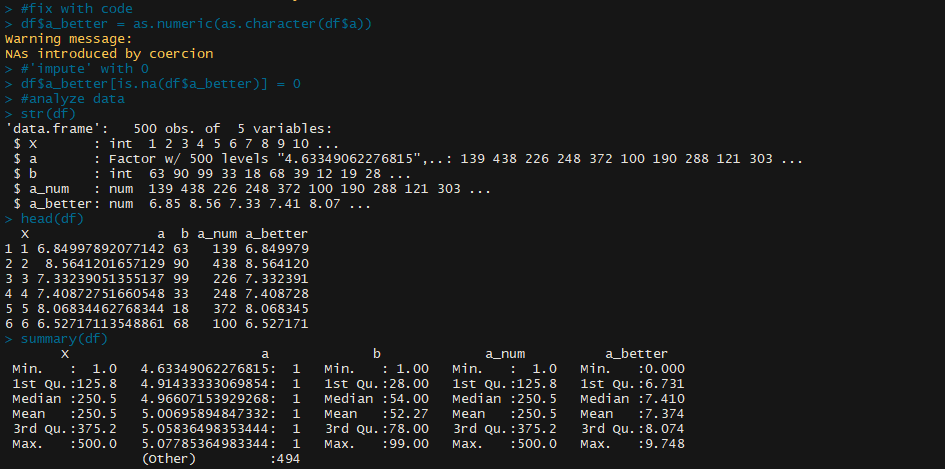
Now we see the column 'a_better' seems to directly represent the original values in 'a'.
The combination of these functions make it easy to:
- Avoid our initial type conversion issue.
- Discover why our data that was assumed numeric is not all numeric, and DO SOMETHING about it.
TIMES I'VE ALMOST BEEN BURNT BY FACTOR CONVERSIONS
To finish this up I thought I would give two examples of times when I've almost been burnt by this functional weirdness in R.Scenario One
I was analyzing a dataset that had an interesting distribution-it was monetary data, but rounded to the nearest dollar, and involved integer values from -1 to 250-with some higher outliers. Remember that as.numeric() replaces a factor scale with an integer index starting at 1. The dataset also included some NULL values, represented by the word NULL (this is how the Python-Spark export created the data).
When I downloaded and imported the data it initially came in as factor, and (not thinking) I simply forced the type conversion. This had the effect of creating NA from the prior NULLs which I knew were assumed 0's and fixed with a simple df[is.na(df)] = 0 statement. The problem was that now my scale was shifted approximately two values higher due to the initial distribution-but the variance was still the same, the percent of 0's were reasonable, and generally the data was still reasonable.
After about an hour of working with the data, I noticed that I was a bit too far off of control totals I had run in PySpark, and backed into my problem, fixed and moved on.
This speaks to a major risk in the factor conversion problem: when the dataset is made up of integers very near zero, the error is difficult to detect.
Scenario Two
In scenario two I was dealing with geospatial data, a polygon shapefile at the zip code level (what our external vendor could handle). I had crossed it with a few massive 'points layers' and was creating an analysis of output zips using some fairly massive distance and customer travel pattern analytics. At one point I needed to link the zip codes up to some additional zip code based data, but the join failed because the zip codes were factors.
Knowing I was only dealing with zip codes in the United States, I quickly used the as.numeric() without thinking. In this case (if you know about zip codes you can imagine what happened) the new factor levels lead to effectively a scramble join. I would have missed this completely, except that my last step involved visualizing the zips in a nationwide map-which looked completely random.
The point of this anecdote: as usual, visualizing data can be a powerful check against otherwise undetectable coding mistakes.
CONCLUSION
Factors in R can be a powerful statistical tool, but under a few scenarios in type conversion, they can cause issues. This blog post provided:- A general description of the issue.
- A couple of methods including a function to find non-numeric values in a factor.
- Some warnings of difficult-to-detect errors.
Saturday, February 3, 2018
Twitter Blocking: Fast-Scan Social Algorithms
Summary Points:
When I go on Twitter, I'm often confronted with this view:


I am blocked by thousands of people on Twitter. When I tell people about this publicly they often react in thinking I must be the worlds most massive troll (but I'm not). But most of these "blockers" are accounts that I've never interacted with, they have essentially blocked me either categorically or because I'm part of a massive block list.
Blocking has become a major part of the user experience on Twitter for many reasons, and that's largely out of the scope of this blog. To understand how someone ends up blocked like me; you should understand two products:


 TL;DR version: A guy who invented the term "vice signaling," a liberal writer, another liberal writer, a standup comedian, and a former Star Trek actor.
Digging into the data around who blocks me, we can generally describe the nature of people who tend to block me by comparing how the words on their profiles compare to the words on the profiles of people who *don't* block me. Below is a list of those words and their indication of risk.
 A score of 1.0 deems that this word neither increases the probability that a user will block me, a score of 2.0 is twice as likely to block, whereas a score of 0.5 is half as likely to block. There are two effective dimensions to the majority of people who block me:
And because I know everyone loves wordclouds (sarcasm), on a recent long social scan, I created wordclouds of people who block me. Here's what that looks like, first looking at those who block me:


Apparently, unbeknownst to me, I am loved by dog/pet lovers (potentially an artifact of sampling, rescan method-but few of the dog-lover accounts blocked me).

Note: This code is simply for a single user. The entire application I wrote is a full iterative search-for-user, check block status, recursively search for more users, model, repeat application in Python with a Microsoft SQL Server backend that I am not publishing in whole at this time, for various reasons.

Data was clean at this point and essentially ready for modeling. Dependent variable was whether or not I was blocked, N was all accounts "checked" to date, independent variables are as listed above.

Far above I covered where to start with a large number of account to check, deciding on followers of Wil Wheaton and the BlockTogether follower list. But once I've checke all of these accounts where should I go? Here I implemented two strategies:
- Over 3100 people block my personal account on Twitter.
- I created an algorithm to crawl Twitter and find people who block me.
- Those people appear to be mainly aspiring authors and members of the anti-Trump "resistance."
When I go on Twitter, I'm often confronted with this view:

Trying to see the unavaible tweet, I click through and see this:

I am blocked by thousands of people on Twitter. When I tell people about this publicly they often react in thinking I must be the worlds most massive troll (but I'm not). But most of these "blockers" are accounts that I've never interacted with, they have essentially blocked me either categorically or because I'm part of a massive block list.
Blocking has become a major part of the user experience on Twitter for many reasons, and that's largely out of the scope of this blog. To understand how someone ends up blocked like me; you should understand two products:
- Block together: A program that gives users the ability to share block lists and otherwise categorically ban accounts.
- Twitter Block Chain: This chrome extension is (poorly named) used to block all users of a specific account. For instance, it could be used to block anyone who follows @realDonaldTrump
After a day when I found a couple of random accounts blocking me. I realized their was a Data Science angle, specifically:
- Can I use an algorithm to scan Twitter and accounts that block me?
- Can I optimize the algorithm with Machine Learning to predict accounts likely to block me and make my initial algorithm find blockers more quickly.
The answer to these questions ended up being "yes" and "yes." Here I'll describe the results, first with a description of results and then a concept of the data science method.
THE DATA: WHO BLOCKS ME
To-date, I've used an algorithm to find about 3100 people who block me on twitter. Releasing the full list would seem to be doxxing-however the public nature of which "verified" accounts block me seems less problematic. Here's a listing with evidence of some "celebrity blocks":


Digging into the data around who blocks me, we can generally describe the nature of people who tend to block me by comparing how the words on their profiles compare to the words on the profiles of people who *don't* block me. Below is a list of those words and their indication of risk.

- People who are part of the liberal "resistance" to Donald Trump (which is a bit bizarre because I'm not a Trump supporter-though I was very anti-Bernie Sanders).
- "Geeky" authors and writers-this is speaks to the Wil Wheaton theory of my epic blocked status (see below).
And because I know everyone loves wordclouds (sarcasm), on a recent long social scan, I created wordclouds of people who block me. Here's what that looks like, first looking at those who block me:

And those who do not:

Apparently, unbeknownst to me, I am loved by dog/pet lovers (potentially an artifact of sampling, rescan method-but few of the dog-lover accounts blocked me).
HOW I ENDED UP BLOCKED
To begin my methodology, I started with a bit of a priori theory-specifically-what are the incidents that led to my blocking? I'm blocked by people across the political spectrum, from conservative politicians in my own state to "resistance" members that are famous nationwide.. and an odd number of science fiction writers (I'm not a fan, don't care). Here were my best theories of my own blocking:
- I was added to Wil Wheaton's block list after telling him to "Shutup Wesley" one too many times.
- I got into a few arguments that led to individual blocks with Bernie bros when I was pointing out some misconceptions they had about tax policy.
Wheaton's block list, as well as the block together App seemed the most likely scenario for wide-spread blocking.
HOW TO DETERMINE IN CODE THAT SOMEONE BLOCKS YOU
Figuring out that someone blocks you via the Twitter API is actually super easy. My initial scanner ran all inside of R, then I ported it to Python using the tweepy package. The basic steps:
- Try to download a user timeline for your target user.
- Catch all errors.
- Check to see if the returned error is code 136.
Here's what that looks like in general Python:

Note: This code is simply for a single user. The entire application I wrote is a full iterative search-for-user, check block status, recursively search for more users, model, repeat application in Python with a Microsoft SQL Server backend that I am not publishing in whole at this time, for various reasons.
HOW TO CHOOSE WHICH USERS TO CHECK-AT FIRST
Knowing that our end goal here is to optimize an algorithm which will tell us which users to check for blocking, we first need to gather an informed set of accounts that will tell us which types of users block us. Using the a priori theory of why users may be blocking me, I turned to two places:
- The followers of the account for the app "BlockTogether"-this may create an artificially high incidence rate-but hey at least I know they follow me.
- Followers of Wil Wheaton-because I know he blocks me, and also shares his block list, so there's a fair chance that his followers would buy into this.

MODELING MY BLOCKERS
Why would I even need to model my blockers? A few reasons:
- I don't have a list of all Twitter accounts, so I need to predict who's followers might block me at high rates.
- These checks rely on the Twitter API, which is rate limited, so it's of great advantage to rank-order accounts in terms of likelihood to block.
- Understanding which people block me gives me insight to the 'why'?
As such I began creating a model against Twitter profile data to determine which accounts are likely to block me. First, what data elements will I have available? The basic elements available are what is pulled from a profile scan of the Twitter API:
- Verified Account?
- # of follows
- # you follow
- date created
- #of favorites
- #of statuses
- Location
- Name
- Description (text description on your profile)
Most of these are fairly easy to analyze, with the exception of the text description (of course, the most rich sense of actual attitudinal data which is likely to predict who you may block). I can't push a text description directly into a ML model, so I took two strategies in creating numeric data from textual data:
- Compute relative frequency between blockers and non-blockers of high incidence words, and then create binary dummies for all words with a skew (measured by binomial test) <.05
- Use a type of Natural Language Processing (NLP) to compute correlated topic models accross the description data; create a variable for each observed topic, and assign the probabilistic association for each user description to fill in the data for each topic.
I tested several types of models (read: ran and evaluated them using R's caret package). Extreme Gradient Boost trees ended up winning (though there wasn't a huge gain). AUC = .85.
Variable importance was interesting:

As expected, textual data was most predictive with several other items also providing important information to the prediction. Note: many of these variables have complex interactive effects inside our XGBTree, so it's not a simple matter of "more followers==more likely to block."
WHICH ACCOUNTS TO CHECK FIRST
What is the value of modeling this data? Because the Twitter API is rate limited I can only check a certain number of accounts per day, so it's good for me to use my rate limit wisely. By predicting which accounts are most likely to block me, I can simply prioritize those and thus increase my find rate. Using this prioritization at first increased my positive block rate by about 3x, from about 0.1% to 0.3%.
HOW TO GET TO NEW ACCOUNTS TO CHECK
Far above I covered where to start with a large number of account to check, deciding on followers of Wil Wheaton and the BlockTogether follower list. But once I've checke all of these accounts where should I go? Here I implemented two strategies:
- I found a relationship between an individuals propensity to block and their followers propensity to block. A quirk of the twitter API is that while blocked from seeing a user's timeline, I can still pull all of their followers. So, I began iteratively pulling all the followers for each block I found.
- I also found a releationship between the probability that you block me, and the incidence at which your followers will block. As such, I began pulling the followers for all high-probability blocking accounts(as determined by model above), regardless of whether they actually blocked me.
- There's an ability to find users via Twitter API using words on their profile, because I already know which words (Lyme, Geek) are associated with blocking me, I simple search Twitter for those words.
This iterative method can lead to a biased sample effect over time-so it's important that you also include some random accounts in your sample OR some that are intentionally in large deviation to your current pull.
CONCLUSION
In the end a few points to take away:
- The culture of Twitter has led to a situation where blocking is pervasive-especially for certain people who end up on block lists.
- I am blocked by many people on Twitter, and by gathering data about these individuals-I can certainly create a general profile of my blockers.
- Using Machine Learning, the Twitter API, Natural Language Processing, and other Data Science Technology, I can pull together a list of people who block me on Twitter.
As a personal aside, I don't care a lot that I'm blocked on Twitter, it doesn't appear to effect my user experience in a material way, as I am not blocked by any accounts I would normally follow and it's not an emotional issue for me. I do find it troubling that the pervasive use of block lists is allowing many Americans to insulate themselves from conflicting points of view, including primarily blocking people with whom they have never interacted with in the past.